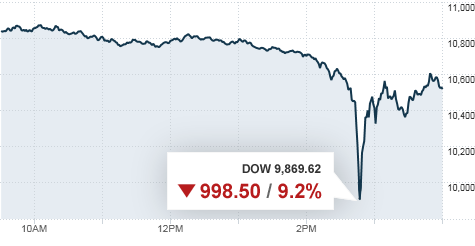
On May 6, 2010, the stock market experienced something that had never happened before - a market plunge of almost 1000 points in a 15-minute span. It was called the "flash crash", and scared investors and market executives alike, even after the market rebounded for the rest of the day to only finish down 3%. What really put fear in the hearts of many was the fact that they knew something like this could happen again. What actually caused this "flash crash"? Let's take an in-depth look, thanks to the help of a report of the day's events released by the U.S. Commodity Futures Trading Commission (CFTC) and the U.S. Securities & Exchange Commission (SEC).
According to the report, May 6 started as an unusually turbulent day for the markets, due in large part to news coming out of Europe concerning the European debt crisis. But nobody could have predicted what would happen that afternoon. The report breaks up the trading day into five phases, which I will summarize:
- First phase (Market Open - 2:32 PM): Stock market indices suffered losses of about 3%, perhaps due to crisis in Europe.
- Second phase (2:32 - 2:41 PM): Markets lost another 1-2%.
- Third phase (2:41 - 2:45:28 PM): Volume spiked upwards as stock prices plummeted another 5-6%, resulting in 9-10% lows.
- Fourth phase (2:45:28 - 3:00 PM): Stock indices started to recover but some individual securities experienced extreme price fluctuations. In some cases, securities were sold from prices ranging to less than a penny to over $100,000!
- Fifth phase (3:00 PM - Market Close): Trading returned to normal levels and most stocks recovered most of what was lost.
So what happened? Well, because of the news from Europe, market volatility was unusually high and liquidity unusually low just before the nosedive. Volatility is the variation of price over time - volatile stocks are normally considered risky investments. Liquidity is an asset's ability to be sold without affecting the price - low liquidity is bad because a single trade can have a big impact on a stock's trading price.
The S&P volatility index (VIX) was up 22.5% by 2:30 PM because of pressure to sell stocks. Additionally, liquidity in the E-Mini S&P 500 futures contracts as well as the S&P 500 SPDR exchange traded fund, the two most active stock instruments traded in futures and equity markets, had declined 55% and 20%, respectively.
Then, with this background of high volatility and low liquidity, a mutual fund group initiated a major trade that would sell a total of 75,000 E-Mini contracts, valued at about $4.1 billion. Although not named in the CFTC/SEC report, this firm was instantly identified as Waddell & Reed Financial Inc. Now typically, such a large sell order, when executed algorithmically (which is what they were doing), would take hours. However, their algorithm didn't take prices or time into account, it just looked at trading volume (which was already high because of the high volatility in the market). As a result, this enormous sell order took just 20 minutes instead of several hours. This is what wreaked havoc on the market - High Frequency Traders (HFTs) from around the market quickly jumped on the E-Mini contracts. They bought and sold these contracts, in milliseconds, from and to each other, creating a "hot potato" effect. Then, Waddell & Reed's sell order algorithm, seeing the increased volume due to HFTs, pumped more of its orders into the market, creating a feedback loop.
The market plunged. The Dow Jones Industrial Average, the most widely known stock index, lost 998 points, or 9.2%, in just minutes. To put that in perspective: just a 1% change in the Dow Jones, over a whole day of trading, is considered large. A liquidity crisis ensued, and many stocks lost their value quickly. Some HFT algorithms stopped trading because they had not been designed to handle such a situation; the prices were beyond their threshold of trading.
Some investors got really unlucky - a man named Mike McCarthy lost $17,000 on a single trade because his order to sell shares of Procter & Gamble was executed at 2:46 PM, when the price was at rock bottom. Some hedge funds lost millions because they placed bets at the wrong time.
The blame game is still going on - an opinion article published by Bloomberg posits that it was the HFTs, not Waddell & Reed, who sucked liquidity from the market and caused the crash. Others argue that it wasn't the HFTs' algorithms that failed, it was the one from the mutual fund.
Regardless of who caused the flash crash, we know the facts. It happened. Another flash crash is not impossible. What can be done to prevent another flash crash from happening? How is confidence in the market affected by events like this?
Sources:
[1] Buchanan, Mark, "Flash-Crash Story Looks More Like a Fairy Tale", Bloomberg View, May 7, 2012, http://www.bloomberg.com/news/2012-05-07/flash-crash-story-looks-more-like-a-fairy-tale.html
[2] Kirilenko, Andrei A., Kyle, Albert S., Samadi, Mehrdad and Tuzun, Tugkan, "The Flash Crash: The Impact of High Frequency Trading on an Electronic Market", May 26, 2011, http://ssrn.com/abstract=1686004
[4] "What Caused the Flash Crash? One Big, Bad Trade", The Economist, October 1, 2010, http://www.economist.com/blogs/newsbook/2010/10/what_caused_flash_crash

This post makes one principle of HCI very relevant: graphs can be very deceitful when the axes don't start at 0. With time, it wouldn't make sense to start at 0, but having an expanded time horizon could be enlightening. For instance, if you look at a graph from April to June (http://www.google.com/finance/historical?cid=983582&startdate=Apr+1%2C+2010&enddate=May+31%2C+2010&num=30&ei=cjSWUIjoFKKaiAKTuQE), you can't easily tell where the flash crash happened.
ReplyDeleteSimilarly, if you expand the stock price graph to include 0, the loss seems much less dramatic than it does in your graph, which makes a 10% dip look like a 100% dip.
That isn't to say that the flash crash was insignificant. However, expanding the axes gave me a bit more perspective on it than I had in the past.